AI maps global ocean industrialization, revealing blind spots

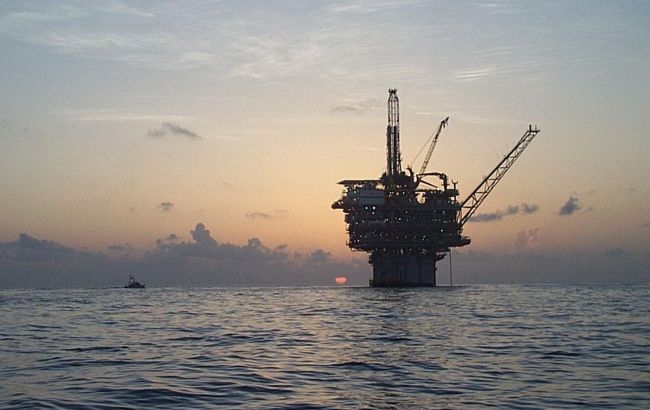 The number of offshore oil rigs has increased in recent years (photo: Getty Images)
Artificial intelligence assisted scientists in analyzing terabytes of satellite data, creating a global map of ocean industrialization, and identifying "blind spots" - areas of illegal human activity.
RBC-Ukraine (Styler project) reports on the latest research and its findings. The sources used in preparing the material include Nature and Global Fishing Watch.
What is known about the research
Recently, a study (conducted under the auspices of Global Fishing Watch and Google) on the world's water resources and their utilization by humanity was published in the journal Nature.
The focus was on the "industrial" use of the world's oceans and the changes that have occurred in this area in recent years.
Satellite images of water resources and the application of artificial intelligence helped scientists:
- Create a global map of ocean industrialization (vessel movements, development of maritime infrastructure, fishing, etc.)
- Observe changes in human activity at sea.
According to the researchers, this will aid in monitoring fishing vessels and identifying illegal activities on the water.
 Traffic of different types of vessels and marine infrastructure (infographic: globalfishingwatch.org)
Use of artificial intelligence
As part of the research, scientists undertook the analysis of approximately 2000 terabytes of satellite data collected through specialized "radar" tools for Earth surface observation under various conditions (in darkness or through clouds).
To process the vast amount of information, researchers developed three AI models, which accurately classified all identified vessels with up to 97% precision, allowing them to:
- Classify all detected vessels
- Estimate their sizes
- Sort them by different types of activities
In total, experts examined about 15% of the world's oceans, the "most active zone," where approximately 75% of all human industrial activity takes place.
This includes the movement of vessels and the development of stationary marine structures (oil rigs, wind turbines, etc.) in the time span from 2017 to 2021.
 Fishing activities tracked or not tracked publicly (infographic: nature.com)
What "white spots" did scientists discover
Until now, most organizations overseeing the protection of water resources relied on the Automatic Identification System (AIS) for maritime activities, which showed what was happening in the oceans.
This system tracks vessels using radio signals but has significant limitations—it can be easily turned off or travel to areas with weak signals.
Within the new research, scientists identified a series of "blind spots" and "white spots" previously unnoticed. They learned, for instance, that:
- At almost any given time, an average of 63,000 vessels are in the ocean (about half of them are fishing vessels).
- Approximately 25% of transportation and energy vessels are not publicly tracked.
- 75% of industrial fishing vessels are also not monitored by public tracking systems (most of these "hidden" vessels operate in Africa and Southeast Asia).
- The number of oil structures increased by 16% in almost five years.
- The number of wind turbines exceeded the number of oil structures by 2020 (most wind energy facilities appeared near the coasts of Northern Europe and China).
 Marine infrastructure (infographic: globalfishingwatch.org)
Reminder: Earlier, Ukrainian scientists detected a sudden increase in chlorophyll in the ocean and explained the potential consequences.